PickMe Ride Analytics
Turning Ride-Hailing Data into an Interactive User Experience

The Challenge
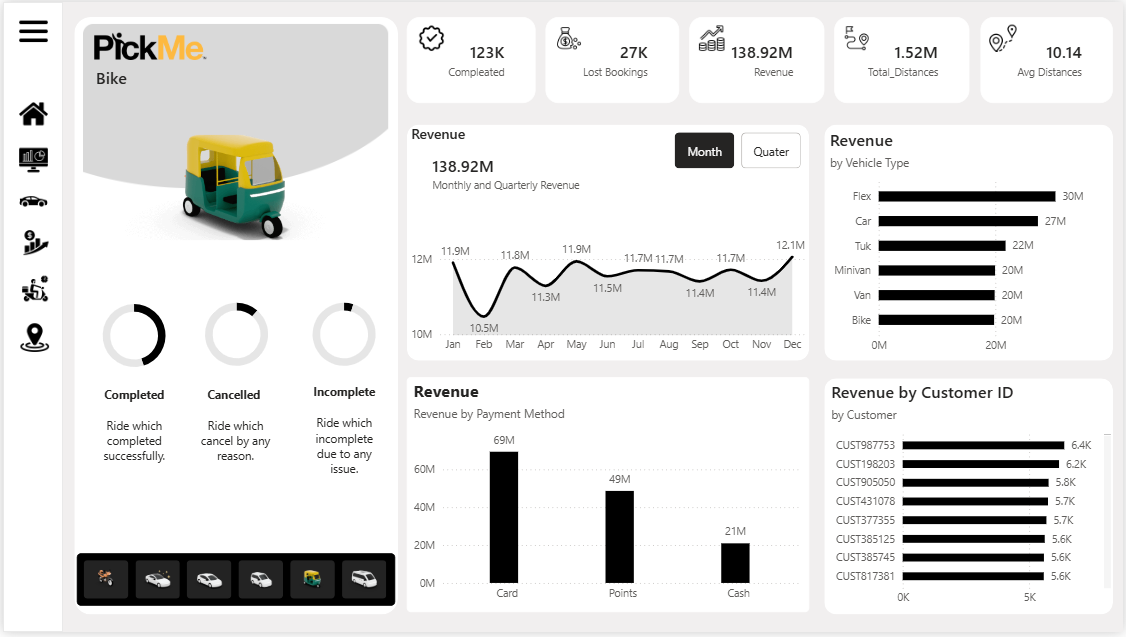
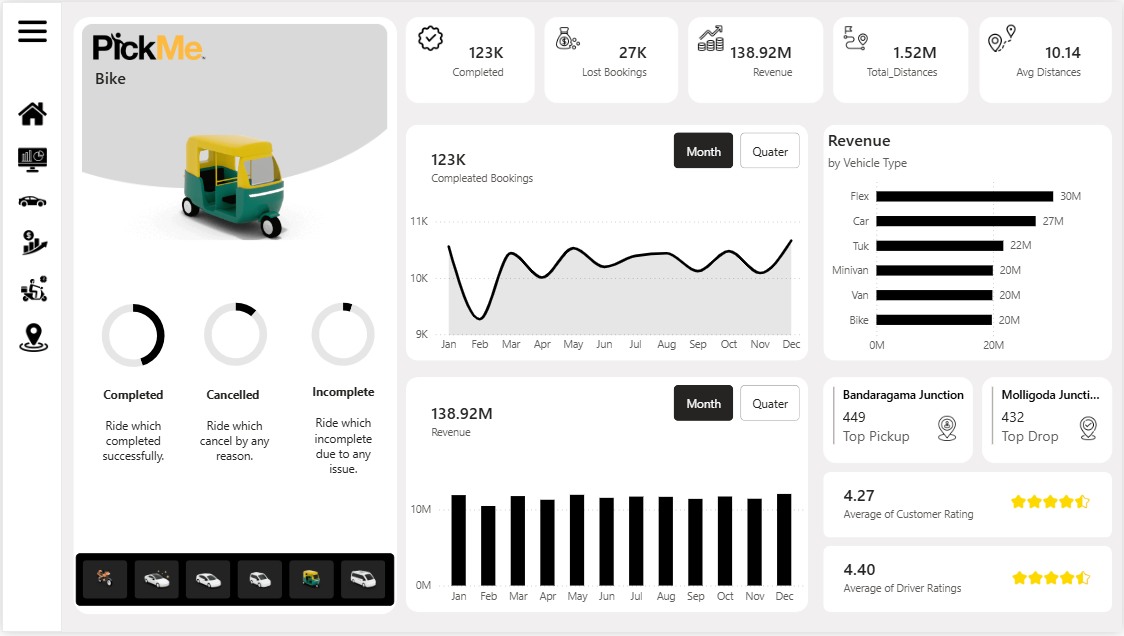
This project explores how data visualization and storytelling can improve understanding of ride-hailing demand. Using 138,000 PickMe booking records, the focus was not on building an application, but on designing clear, experience-led visualizations that help users intuitively interpret time-based trends. The project serves as a conceptual visualization study, showcasing best practices in Power BI design, modeling, and narrative flow.
The Problem
Time-based data is often: Poorly sorted when grouped into custom hour ranges Displayed in static tables with limited interpretability Disconnected from how users naturally think about time A major technical challenge emerged in the form of a DAX Circular Dependency error while creating custom 24-hour time buckets—breaking the natural chronological order of the visuals.
The Solution
The time model was redesigned by separating raw timestamp data from derived time buckets, eliminating circular dependencies and restoring correct chronological flow. This ensured that visual elements—charts, KPIs, and filters—follow a natural progression from midnight to midnight, improving readability and user comprehension.
The Impact
Accurate visualization of peak demand hours Clear comparison of vehicle categories across time Stronger alignment between data structure and visual logic Demonstration of advanced DAX modeling in a visualization context In ride-hailing analytics, timing is a critical visual dimension. This project shows how careful time modeling can significantly enhance insight delivery.
Key Features
Modern Dashboard Design
Dark-mode layout with rounded KPI cards, created using Power BI’s On-Object Interaction features for a contemporary visualization aesthetic.
Dynamic Visual Context
Visual elements update based on selected vehicle types (Bikes, Three-Wheelers, Cars, Luxury), reinforcing data-driven storytelling.
Advanced Time Bucketing
Custom DAX logic to group demand across a full 24-hour cycle while preserving correct chronological order.
Insight-Led Storytelling
Visual flow designed to guide users from high-level trends to detailed time-based patterns.
User-Focused Readability
Clear labeling, spacing, and contrast choices to reduce cognitive load and improve interpretation.
Technologies Used